
BioRender alternatives
12 products compared · Updated October 16, 2026
The short answer
For scientists needing publication-ready figures, Mind the Graph is the strongest free alternative with editable templates. For teams that want full control over vector illustrations without subscription costs, Inkscape is a solid choice. For researchers focused on data analysis and graphing, GraphPad Prism is the best fit.
Your shortlist, at a glance
Read the comparisons ↓- MMind the GraphNot publishedScientists and educators who need a free or low-cost way to make graphical abstracts, infographics, and figures with editable templates.
- SSciDrawNot publishedScientists and educators who need free, ready-to-use illustrations for papers, presentations, or teaching materials.
 Adobe AnimateNot publishedAnimators and motion designers who need a professional timeline-based animation tool for vector art and interactive content.
- IInkscapeFree (open source)Designers and researchers who need a free, flexible vector editor for custom illustrations and diagrams beyond scientific figures.
- GGraphPad PrismNot publishedScientists and researchers who need guided statistical analysis and graphing without coding.
- RR with ggplot2Not publishedResearchers and data scientists who want full control over statistical graphics and reproducible analysis pipelines.
- PPython with MatplotlibFree (open source)Research teams or individuals who already use Python for data analysis and need reproducible, customizable scientific plots rather than pre-made illustrations.
Canva WhiteboardsNot publishedTeams that need a versatile whiteboard for brainstorming and visual collaboration and already use Canva for other design work.
 FigJamNot publishedProduct and design teams that need a collaborative whiteboard for ideation, flowcharts, and sticky-note sessions.
- ddraw.ioNot publishedTeams that need versatile, self-hosted diagramming without per-seat costs or cloud lock-in
Microsoft Azure CycleCloudPay per resourceResearch teams and organizations that need to provision and manage high-performance computing clusters on Azure for workloads like genomics, engineering simulations, or AI training.
 PorterUsage-based + cloudStartups and engineering teams that want to deploy on their own cloud account without managing Kubernetes themselves.
About BioRender and its alternatives
BioRender is a browser-based tool for creating scientific figures, graphs, and slides. It is known for its large library of scientifically accurate icons, AI-assisted figure generation, and collaboration features. Over 4 million scientists use it, and it is cited in 500,000+ publications.
When comparing alternatives, weigh pricing structure (free vs subscription vs usage-based), whether the tool is browser-based or desktop, integration with your existing workflow, and the availability of scientific icons and templates. Also consider contract terms like free plans, credit card requirements, and commercial use rights.
Explore the alternatives
- MNot published
1.Mind the Graph
Best for: Scientists and educators who need a free or low-cost way to make graphical abstracts, infographics, and figures with editable templates.

- Pricing
- Not published
- Category
- Other
Mind the Graph is a browser-based tool for creating scientific figures, graphical abstracts, and infographics with a large library of editable illustrations. Choose it instead of BioRender if you need a free entry point or want to build infographics and presentations alongside standard scientific figures.
Where it is strong
- Free plan available with no credit card required
- 75,000+ editable illustrations across 80+ fields
- Teams & Labs plan supports up to 11 users with collaboration
Where it falls short
- Pricing details are not listed on the website
- Free plan likely restricts commercial or publication use, similar to BioRender
- Pricing:
- Pricing is not published on the site.
- SNot published
2.SciDraw
Best for: Scientists and educators who need free, ready-to-use illustrations for papers, presentations, or teaching materials.
- Pricing
- Not published
- Category
- Other
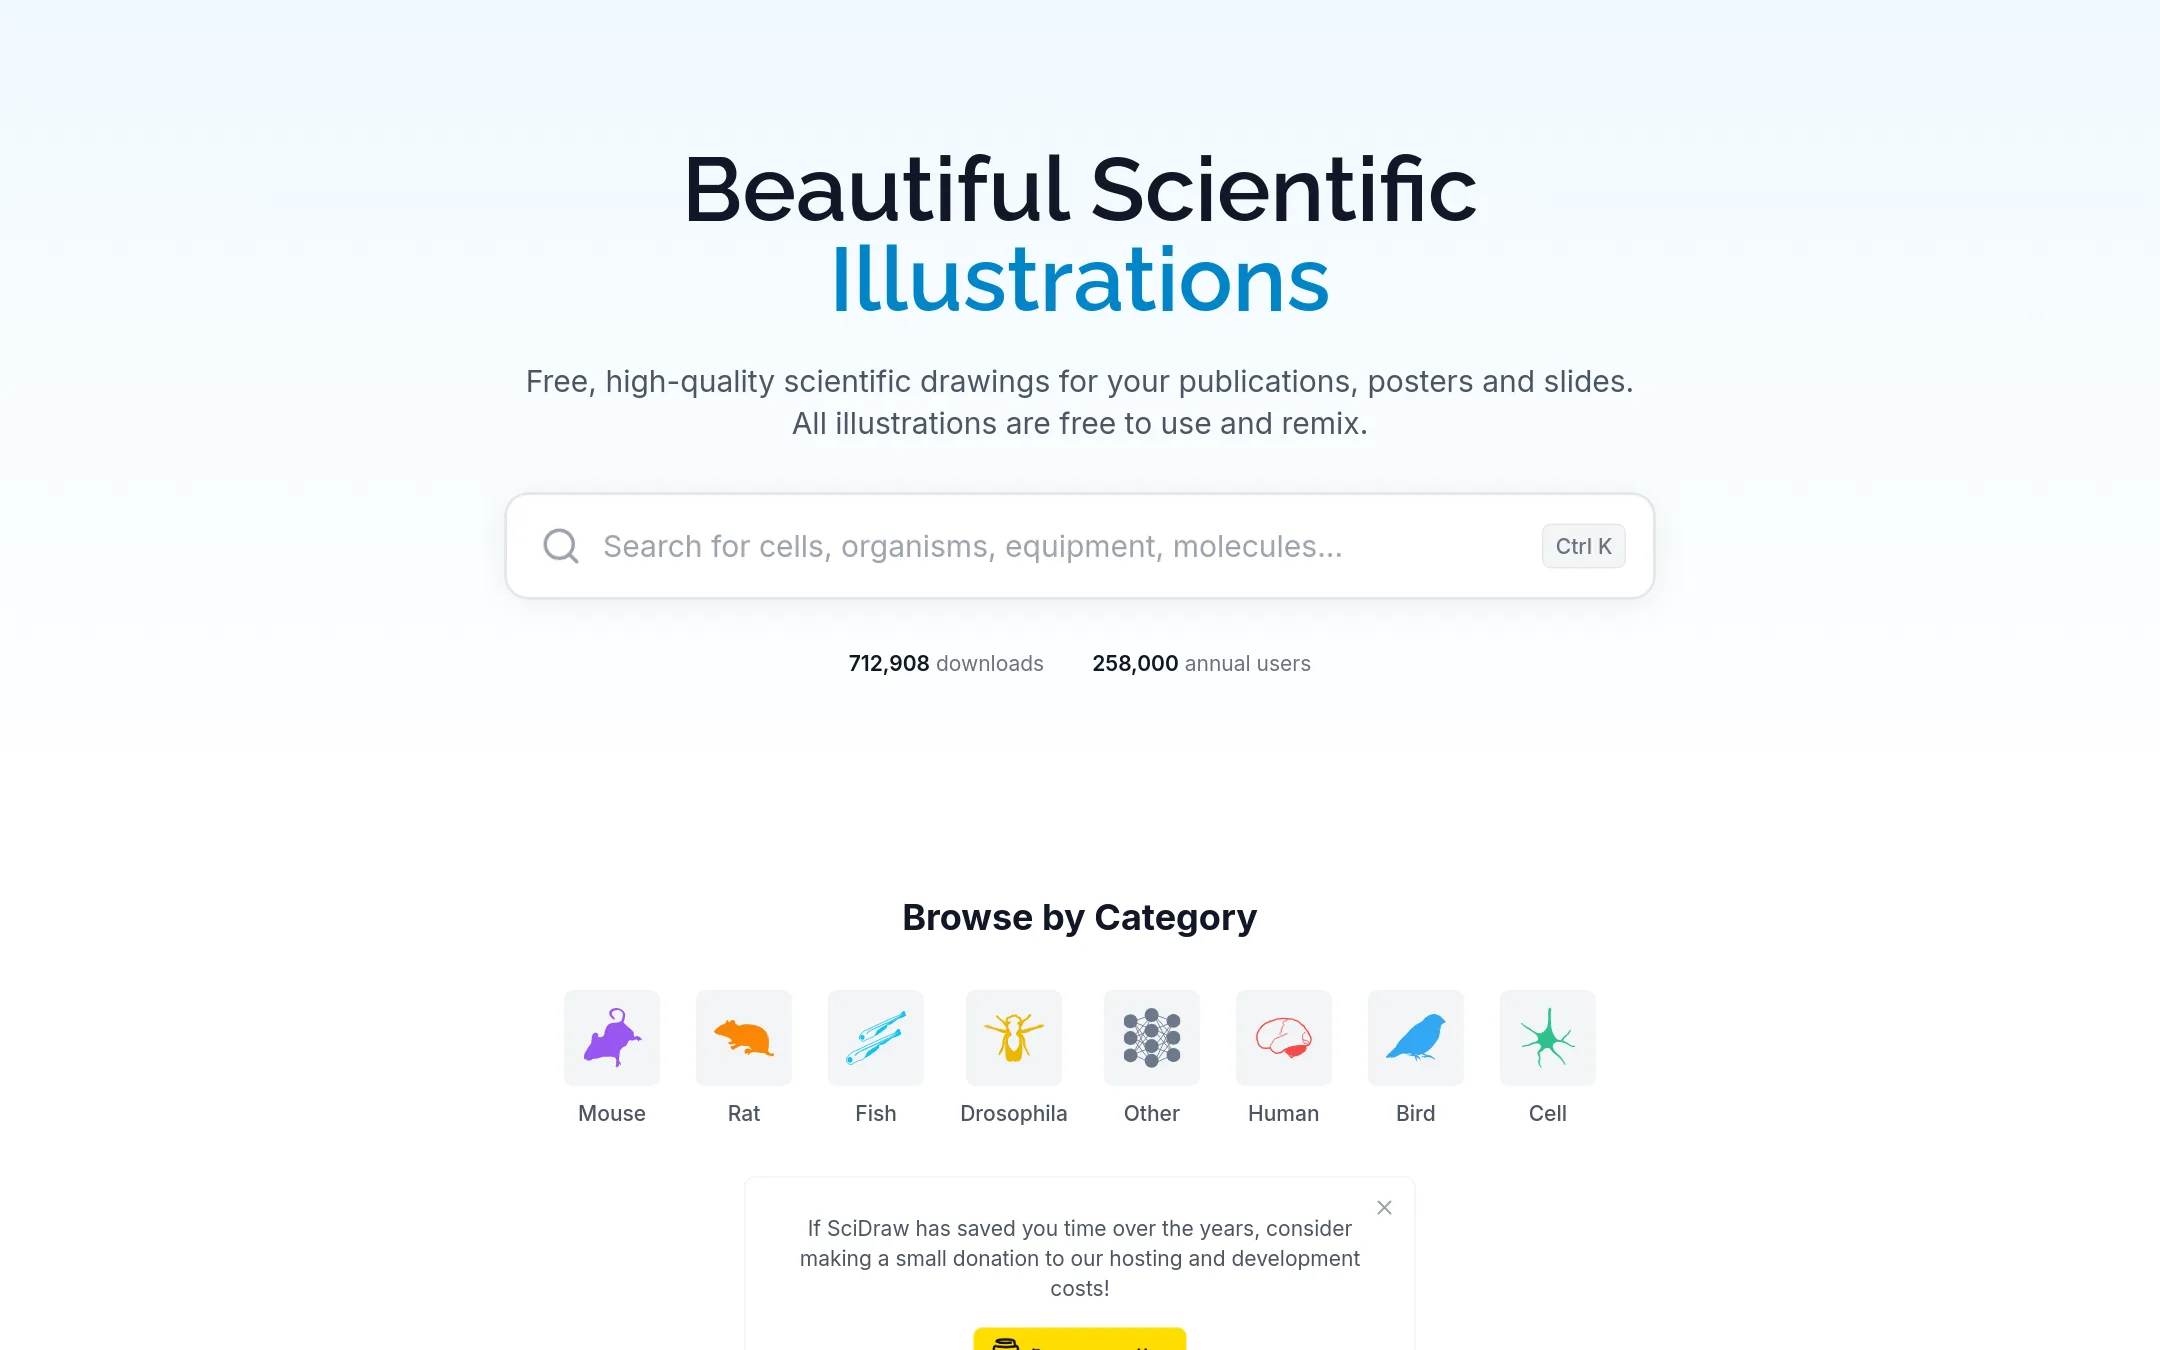
SciDraw is a free library of high-quality scientific illustrations that you can download and remix for publications, posters, and slides. Choose it instead of BioRender when you need individual, CC-BY licensed drawings without paying for a subscription or building figures from scratch.
Where it is strong
- All illustrations are free to use and remix under CC-BY license.
- Includes a DOI for each illustration, making citation straightforward.
- Browse by category and see most-downloaded items to find common visuals quickly.
Where it falls short
- No built-in editor or figure-building tools. You download images and assemble them elsewhere.
- Limited to the illustrations available in the library. You cannot create custom icons or edit elements within SciDraw.
- Pricing:
- Pricing is not published on the site.
- Switching from BioRender:
- Moving from BioRender means downloading individual illustrations from SciDraw and assembling them in your own design software, since SciDraw does not offer an editing workspace.
- Not published
3.Adobe Animate
Best for: Animators and motion designers who need a professional timeline-based animation tool for vector art and interactive content.

- Pricing
- Not published
- Category
- Design & Creative
Adobe Animate is a general-purpose 2D animation tool, not a scientific figure editor. Choose it over BioRender when your goal is frame-by-frame animation, interactive content, or character rigging for video, games, or web, rather than publication-ready scientific diagrams.
Where it is strong
- Industry-standard for 2D animation and vector art
- Supports interactive and game content via HTML5 canvas
- Deep timeline and rigging controls for complex motion
Where it falls short
- No scientific icon library or publication templates
- Steep learning curve for non-animators
- Pricing:
- Pricing is not published on the site.
- IFree (open source)
4.Inkscape
Best for: Designers and researchers who need a free, flexible vector editor for custom illustrations and diagrams beyond scientific figures.
- Pricing
- Free (open source)
- Category
- Other
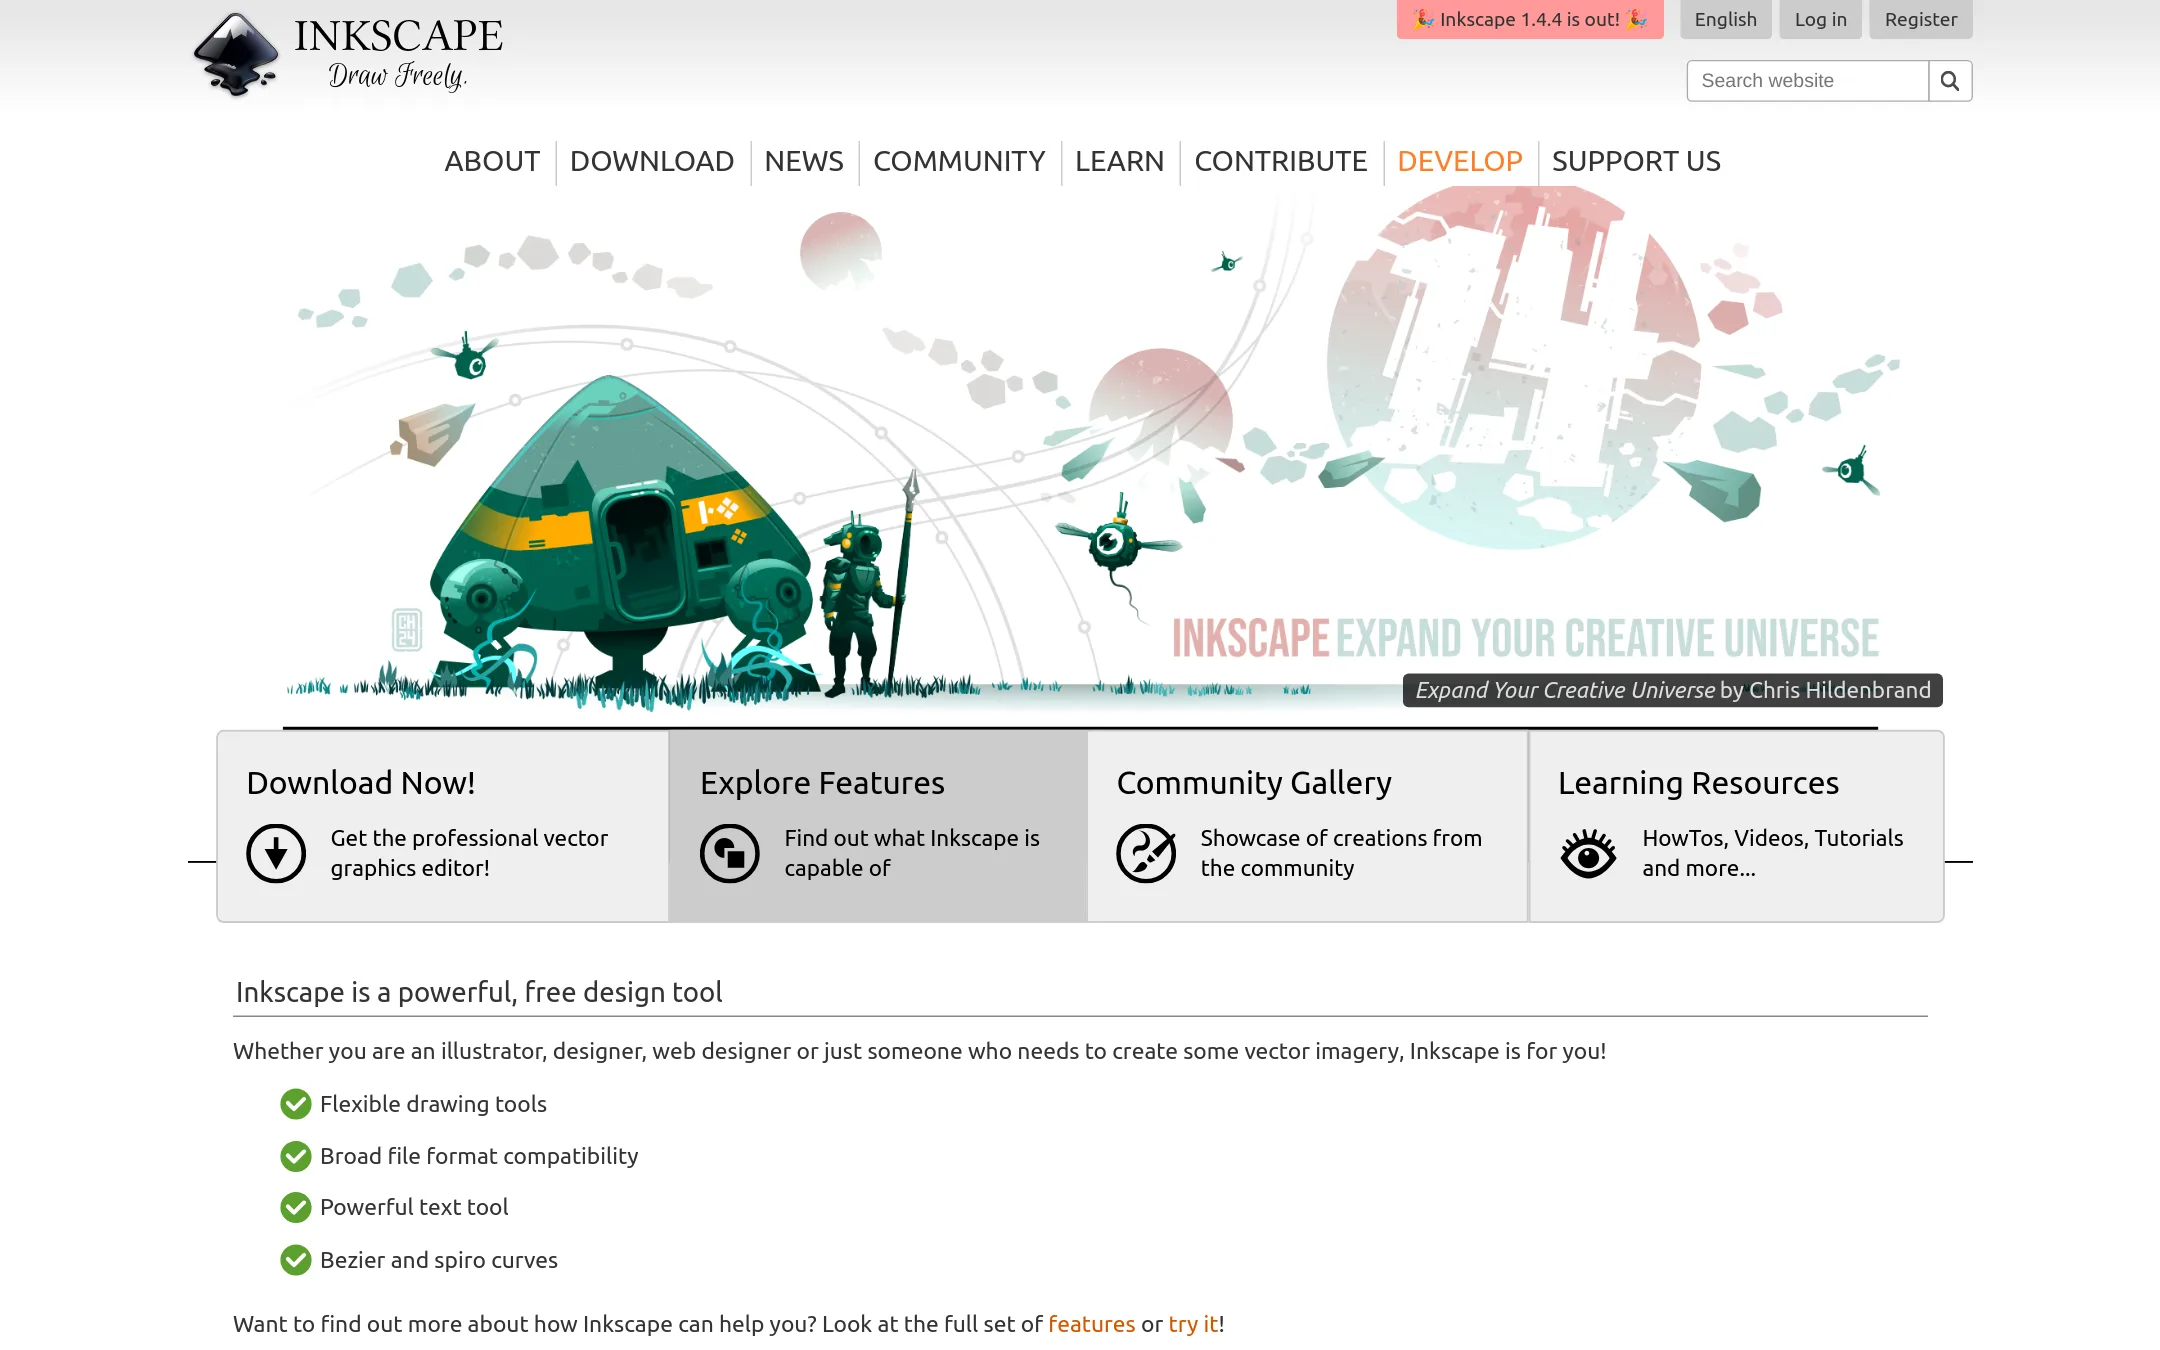
Inkscape is a free, open-source vector graphics editor that runs on Linux, macOS, and Windows. Choose it instead of BioRender when you need full control over vector illustrations for any purpose, not just scientific figures, and you prefer a desktop tool with no subscription or cloud dependency.
Where it is strong
- Free and open source, no subscription required
- Runs on Linux, macOS, and Windows
- Broad file format compatibility and flexible drawing tools
Where it falls short
- No built-in scientific icon library or templates like BioRender
- Steeper learning curve for creating publication-ready scientific figures
- Pricing:
- Pricing is not published on the site.
- Switching from BioRender:
- Moving from BioRender to Inkscape means recreating figures from scratch, as Inkscape lacks BioRender's scientific templates and vetted icon library.
- GNot published
5.GraphPad Prism
Best for: Scientists and researchers who need guided statistical analysis and graphing without coding.
- Pricing
- Not published
- Category
- Other
GraphPad Prism is a desktop statistics and graphing tool built for scientists who need to analyze data and produce publication-quality graphs. Choose it instead of BioRender when your main task is statistical analysis and curve fitting rather than creating illustrated scientific figures.
Where it is strong
- Purpose-built for scientists, with structured data tables and analysis guidance.
- No coding required for complex statistical tests and nonlinear regression.
- Export graphs to many formats or send directly to PowerPoint.
Where it falls short
- Desktop software, not browser-based like BioRender.
- No built-in illustration library for scientific figures.
- Pricing:
- Pricing is not published on the site.
- RNot published
6.R with ggplot2
Best for: Researchers and data scientists who want full control over statistical graphics and reproducible analysis pipelines.
- Pricing
- Not published
- Category
- Other
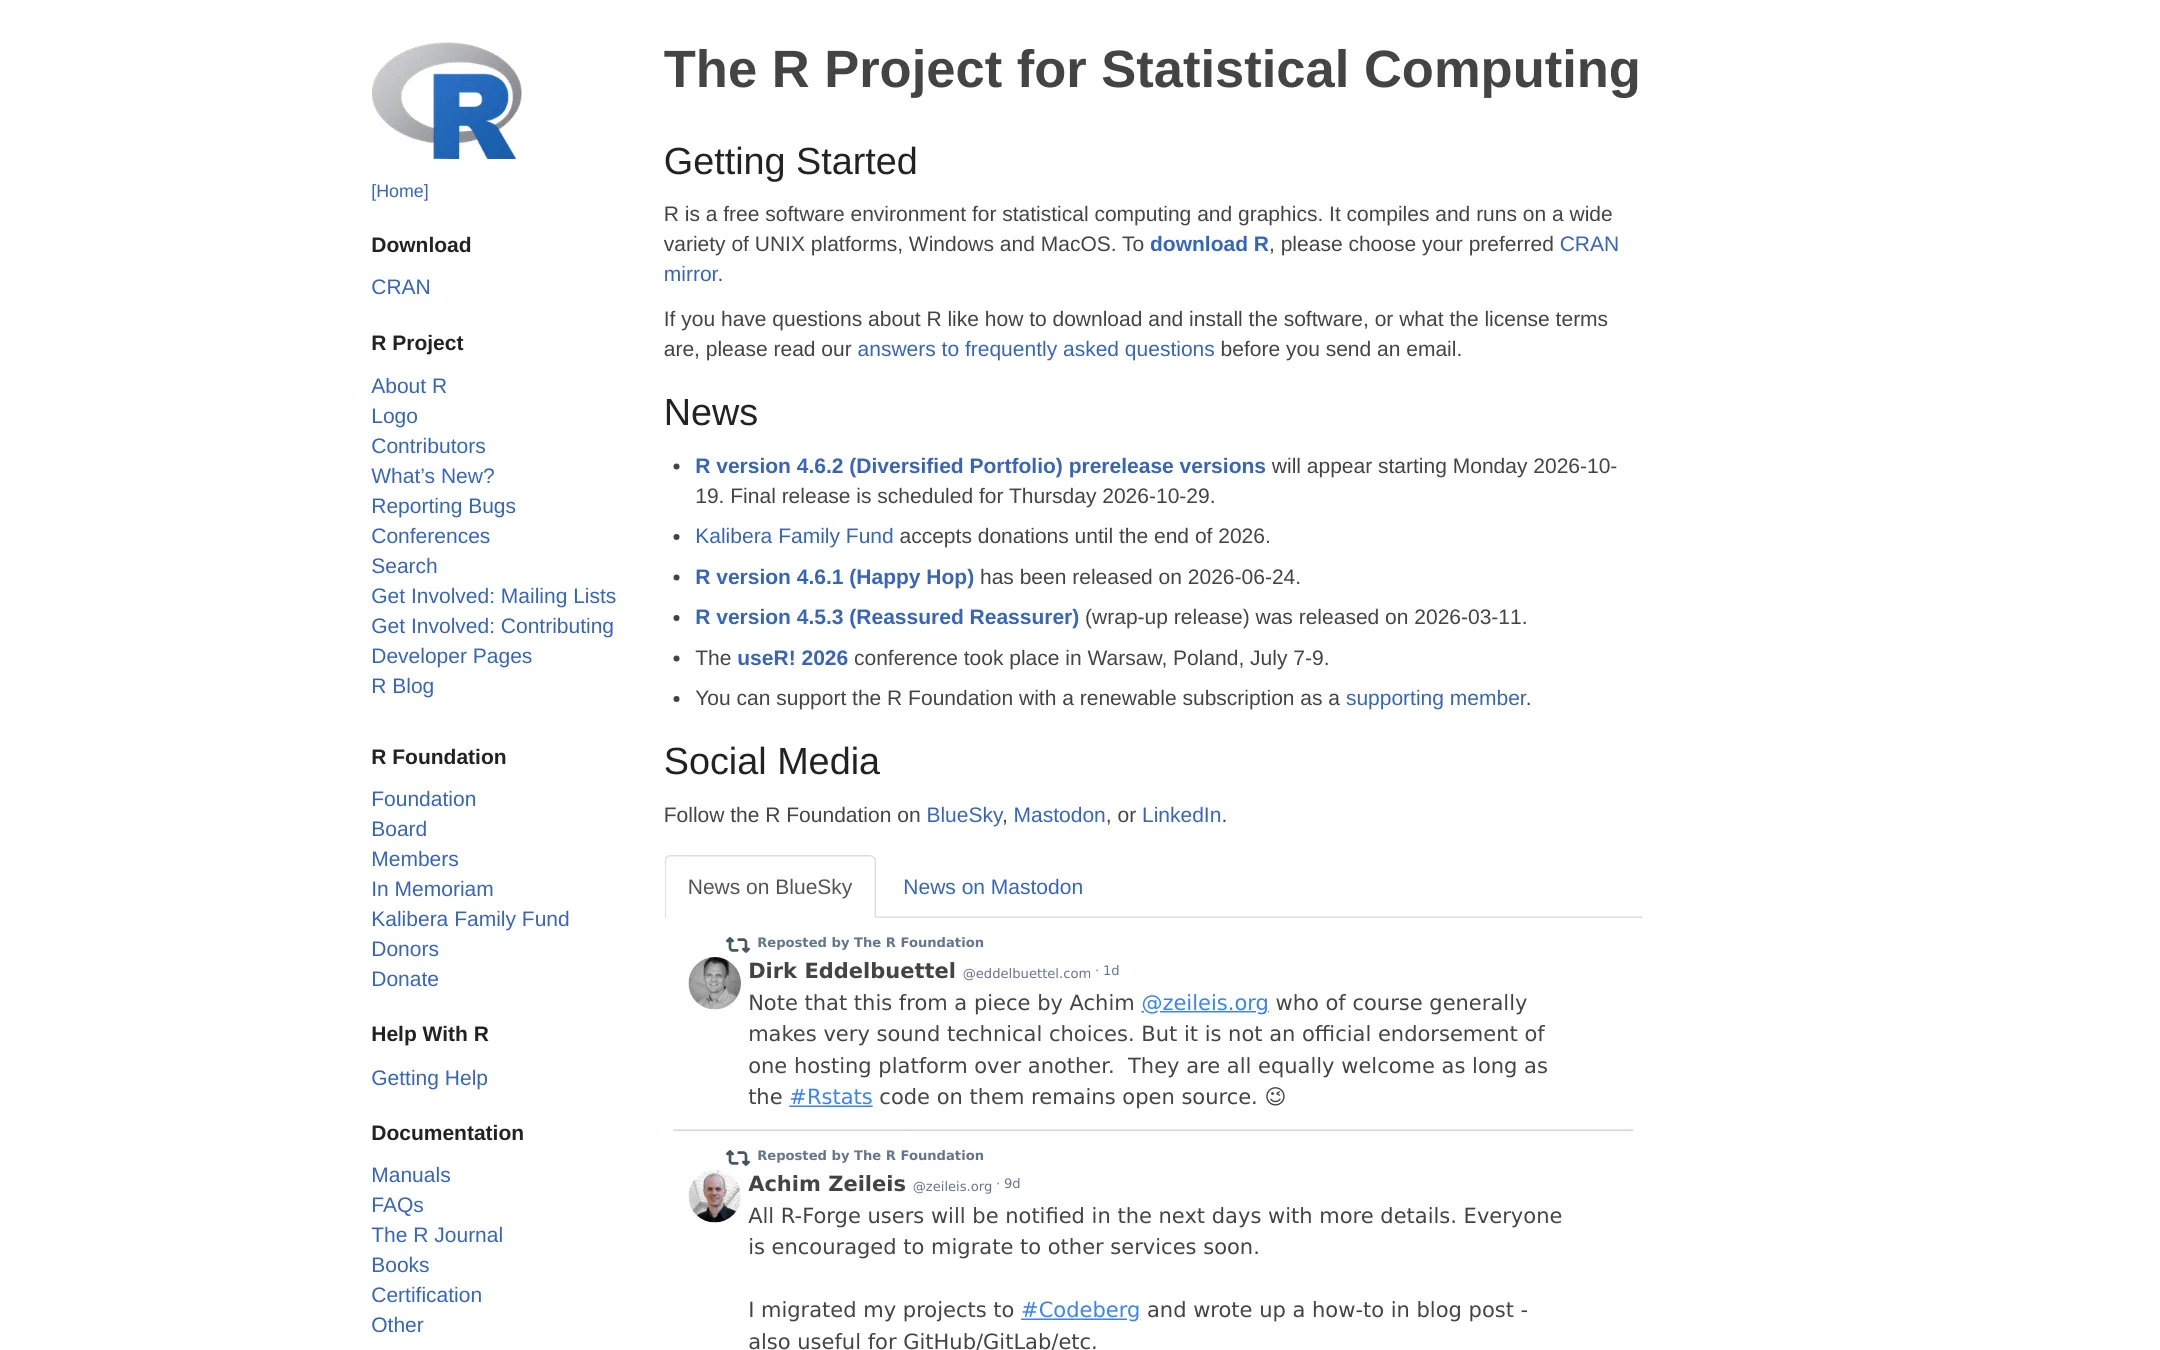
R with ggplot2 is a free, open-source statistical computing environment for creating data-driven graphics. Choose it over BioRender when you need reproducible, publication-quality plots from your own data rather than pre-made scientific illustrations.
Where it is strong
- Free and open-source, no licensing costs
- Unlimited customization of plots via code
- Reproducible graphics integrated with statistical analysis
Where it falls short
- Steep learning curve for non-programmers
- No built-in library of scientific illustrations like BioRender
- Pricing:
- Pricing is not published on the site.
- PFree (open source)
7.Python with Matplotlib
Best for: Research teams or individuals who already use Python for data analysis and need reproducible, customizable scientific plots rather than pre-made illustrations.
- Pricing
- Free (open source)
- Category
- Other
Python with Matplotlib is a free, code-based alternative to BioRender for scientists who need full control over their figures and are comfortable with programming. Choose it when you want to generate publication-quality plots programmatically, automate figure creation, or avoid the cost and constraints of a proprietary tool.
Where it is strong
- Free and open source, no licensing fees
- Full control over every plot element via code
- Reproducible figures that can be regenerated from data
Where it falls short
- Steep learning curve for non-programmers
- No built-in library of scientific icons or templates
- Pricing:
- Pricing is not published on the site.
- Not published
8.Canva Whiteboards
Best for: Teams that need a versatile whiteboard for brainstorming and visual collaboration and already use Canva for other design work.

- Pricing
- Not published
- Category
- Communication & Collaboration
Canva Whiteboards is a general-purpose visual collaboration tool, not built for scientific figures. You would choose it over BioRender if your team already lives in Canva and needs a flexible whiteboard for brainstorming, diagrams, and presentations, rather than publication-ready scientific illustrations.
Where it is strong
- Familiar Canva interface with drag-and-drop design tools
- Real-time collaboration for team brainstorming
- Flexible canvas for diagrams, sticky notes, and presentations
Where it falls short
- No scientific icon library or publication-ready figure templates
- Not designed for journal submission or grant figures
- Pricing:
- Pricing is not published on the site.
- Not published
9.FigJam
Best for: Product and design teams that need a collaborative whiteboard for ideation, flowcharts, and sticky-note sessions.
- Pricing
- Not published
- Category
- Communication & Collaboration
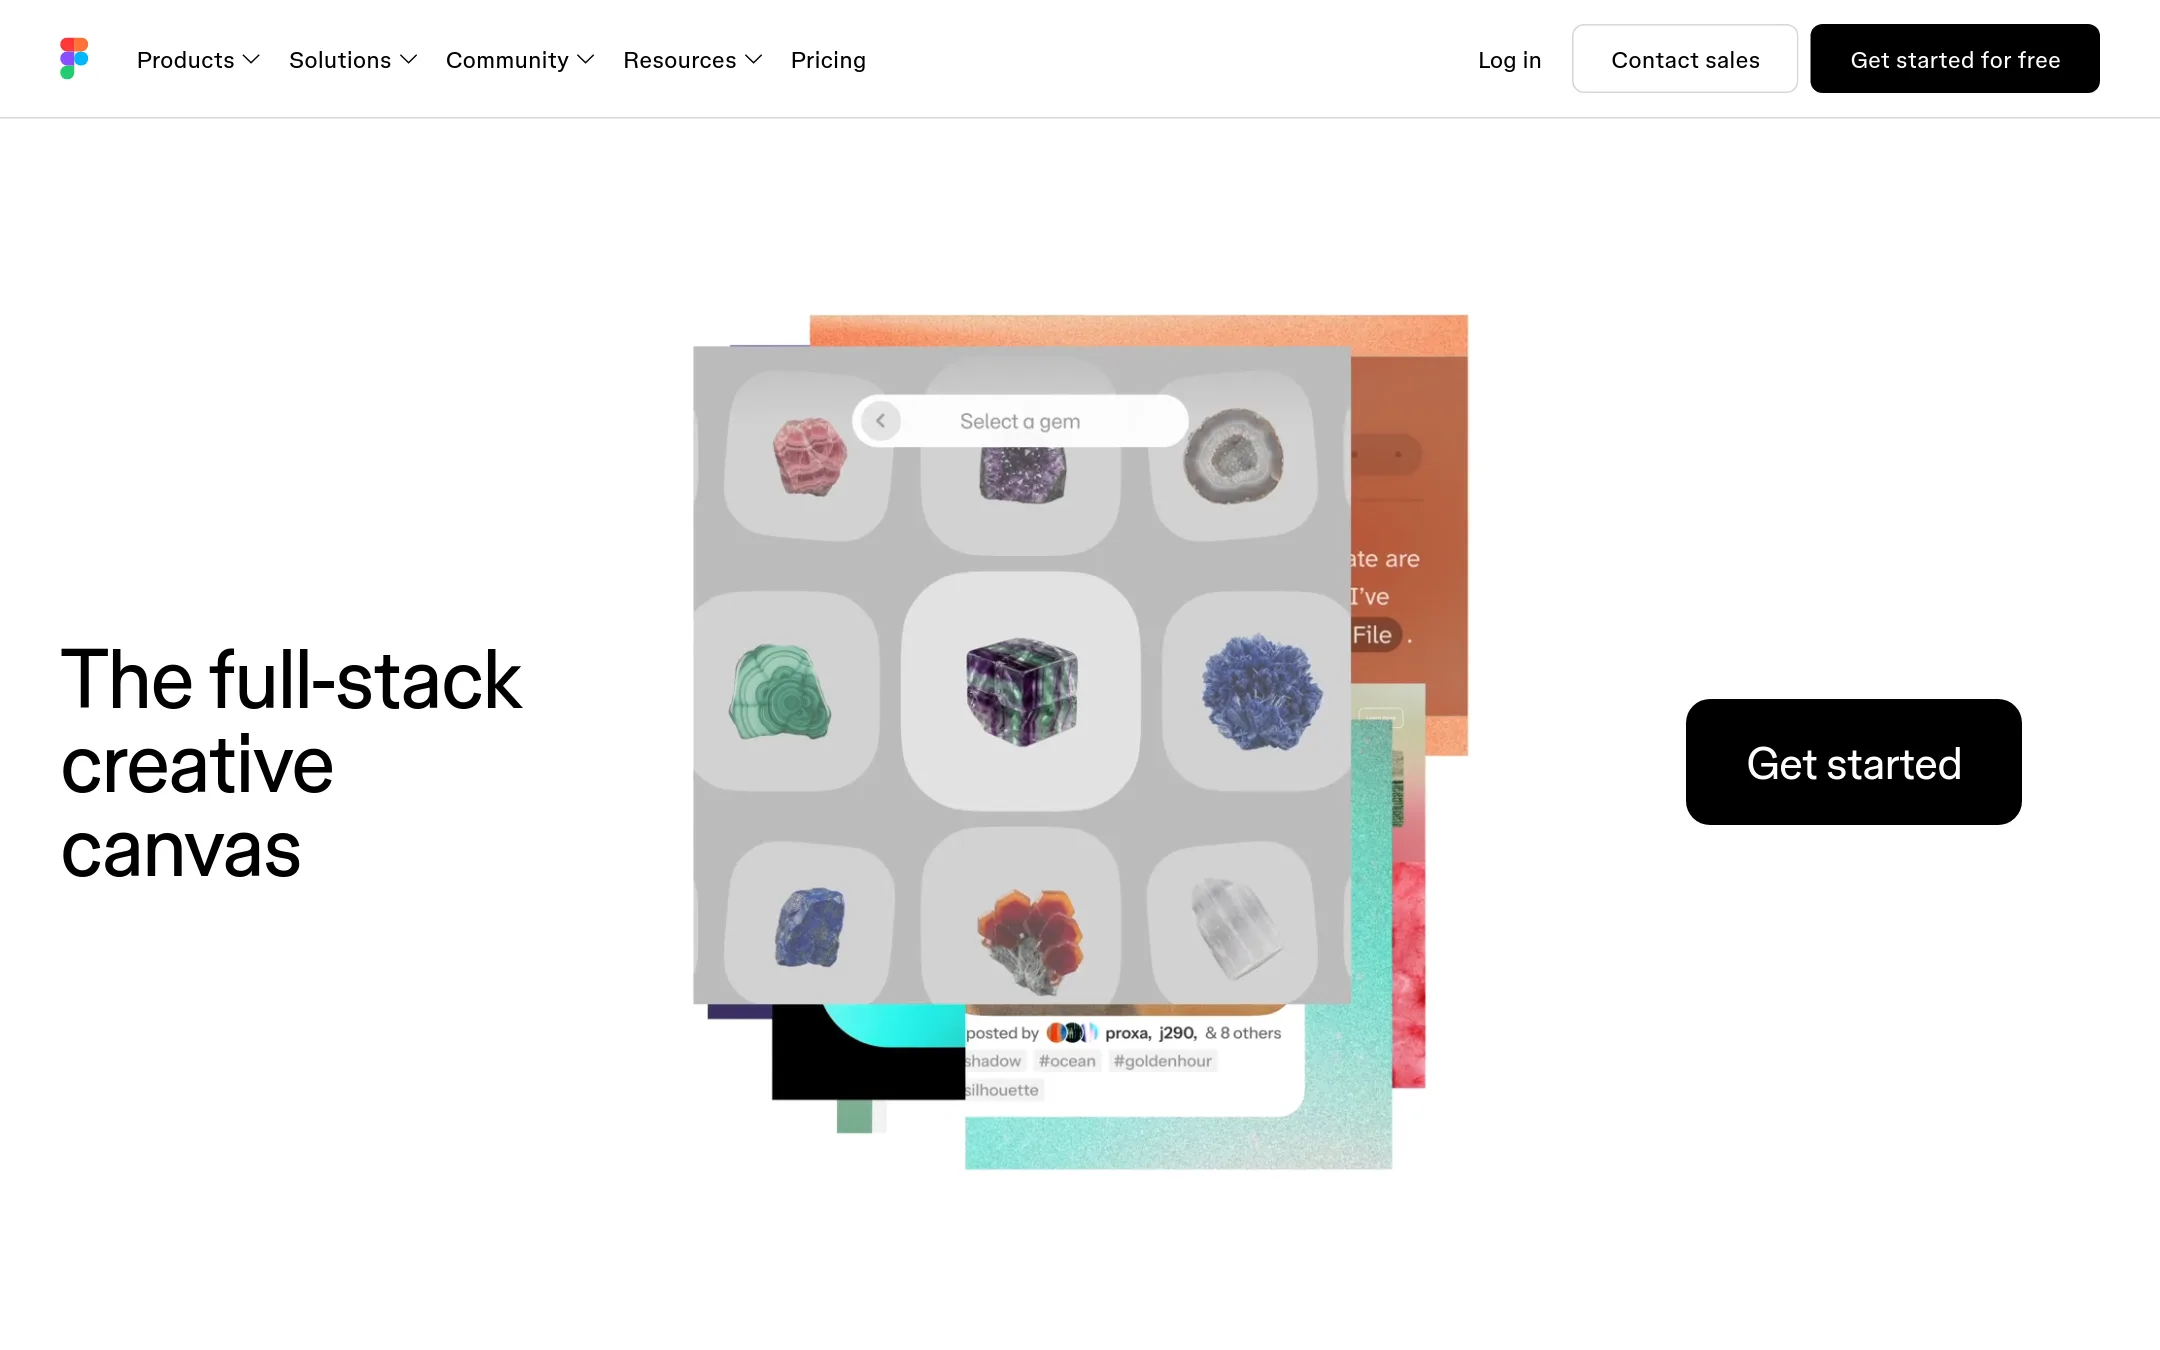
FigJam is a digital whiteboard from Figma for brainstorming, diagramming, and team collaboration. Choose it over BioRender when your work is about product design, workshops, or general visual thinking rather than scientific figure creation.
Where it is strong
- Real-time collaboration with cursors, comments, and reactions.
- Tight integration with Figma design files.
- Templates for common activities like brainstorming and retros.
Where it falls short
- No scientific icon library or publication-ready figure tools.
- Not designed for creating formal scientific illustrations.
- Pricing:
- Pricing is not published on the site.
- dNot published
10.draw.io
Best for: Teams that need versatile, self-hosted diagramming without per-seat costs or cloud lock-in
- Pricing
- Not published
- Category
- Other
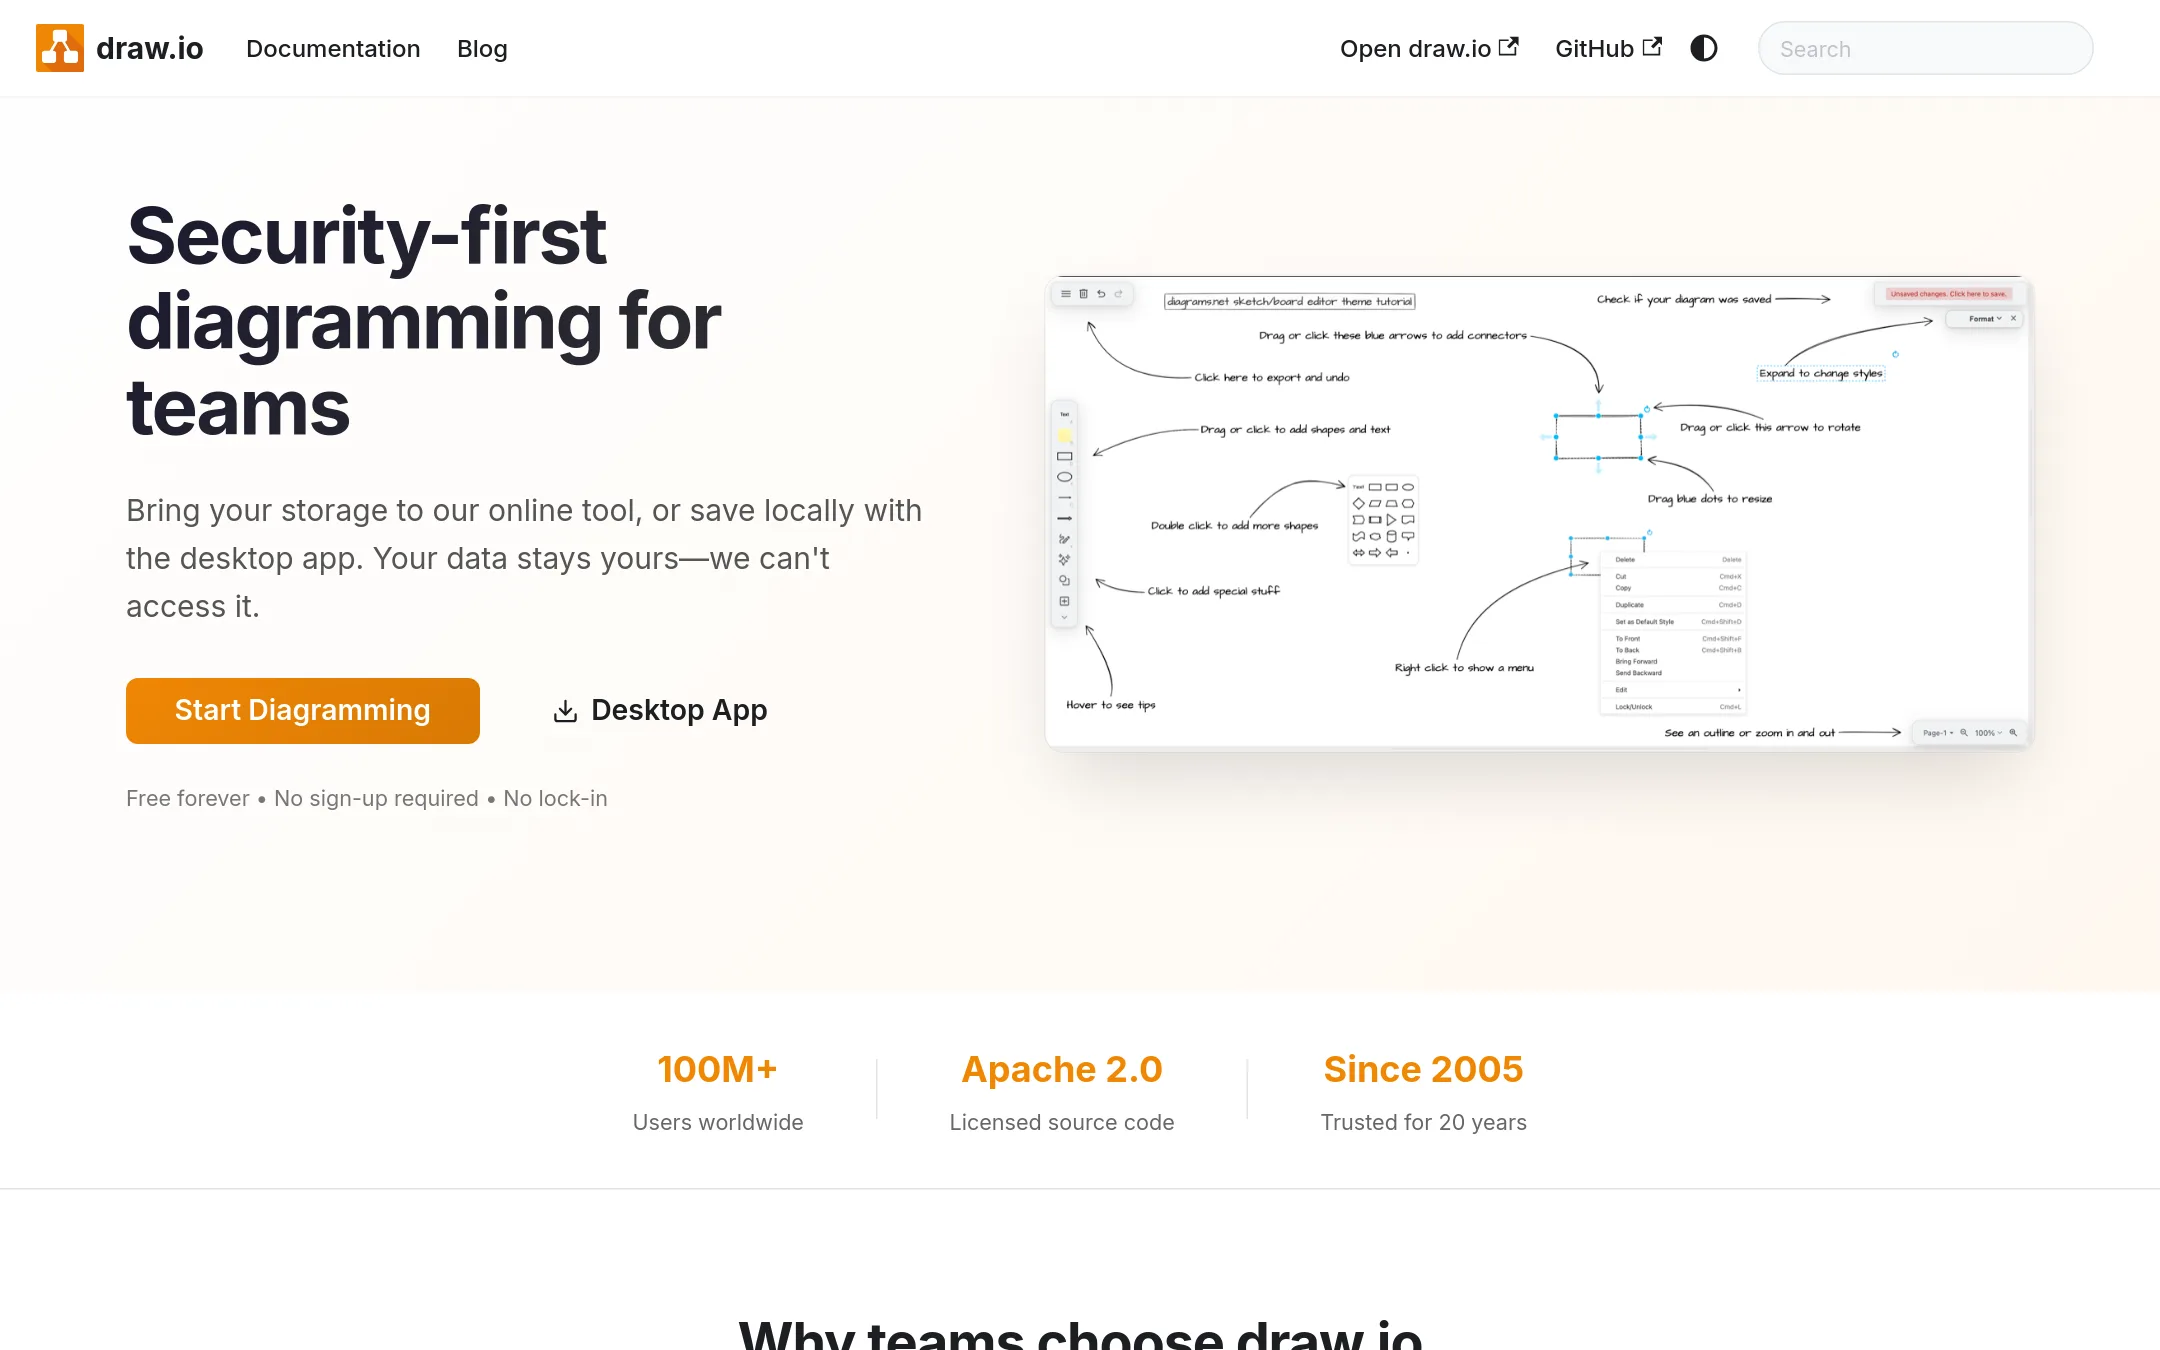
draw.io is a free, privacy-first diagramming tool that works with files you store yourself. Choose it over BioRender when you need general diagrams, flowcharts, or network maps and don't need BioRender's specialized scientific icon library or publication-focused features.
Where it is strong
- Free and open source (Apache 2.0), no account or credit card required
- Files are stored on your own infrastructure, so the vendor can't access them
- Backwards compatible with files from 2005 and works on any platform
Where it falls short
- No scientific icon library or publication-ready figure templates like BioRender
- Lacks BioRender's AI-assisted figure generation and graphing tools
- Pricing:
- Pricing is not published on the site.
- Pay per resource
11.Microsoft Azure CycleCloud
Best for: Research teams and organizations that need to provision and manage high-performance computing clusters on Azure for workloads like genomics, engineering simulations, or AI training.

- Pricing
- Pay per resource
- Category
- Developer Tools
Microsoft Azure CycleCloud is an HPC orchestration tool for managing and scaling compute clusters in the cloud. Choose it over BioRender when your work is about running simulations or processing large datasets, not creating scientific figures.
Where it is strong
- Native integration with Azure services like VM, storage, and networking
- Supports popular schedulers such as Slurm and PBS
- Automates cluster scaling based on workload demand
Where it falls short
- Requires Azure expertise and is tied to the Microsoft ecosystem
- No built-in scientific illustration or figure creation capabilities
- Pricing:
- Pricing is not published on the site. Azure charges per resource used, and CycleCloud itself is a free orchestration layer, but you pay for the underlying compute, storage, and networking.
- Usage-based + cloud
12.Porter
Best for: Startups and engineering teams that want to deploy on their own cloud account without managing Kubernetes themselves.
- Pricing
- Usage-based + cloud
- Category
- Developer Tools
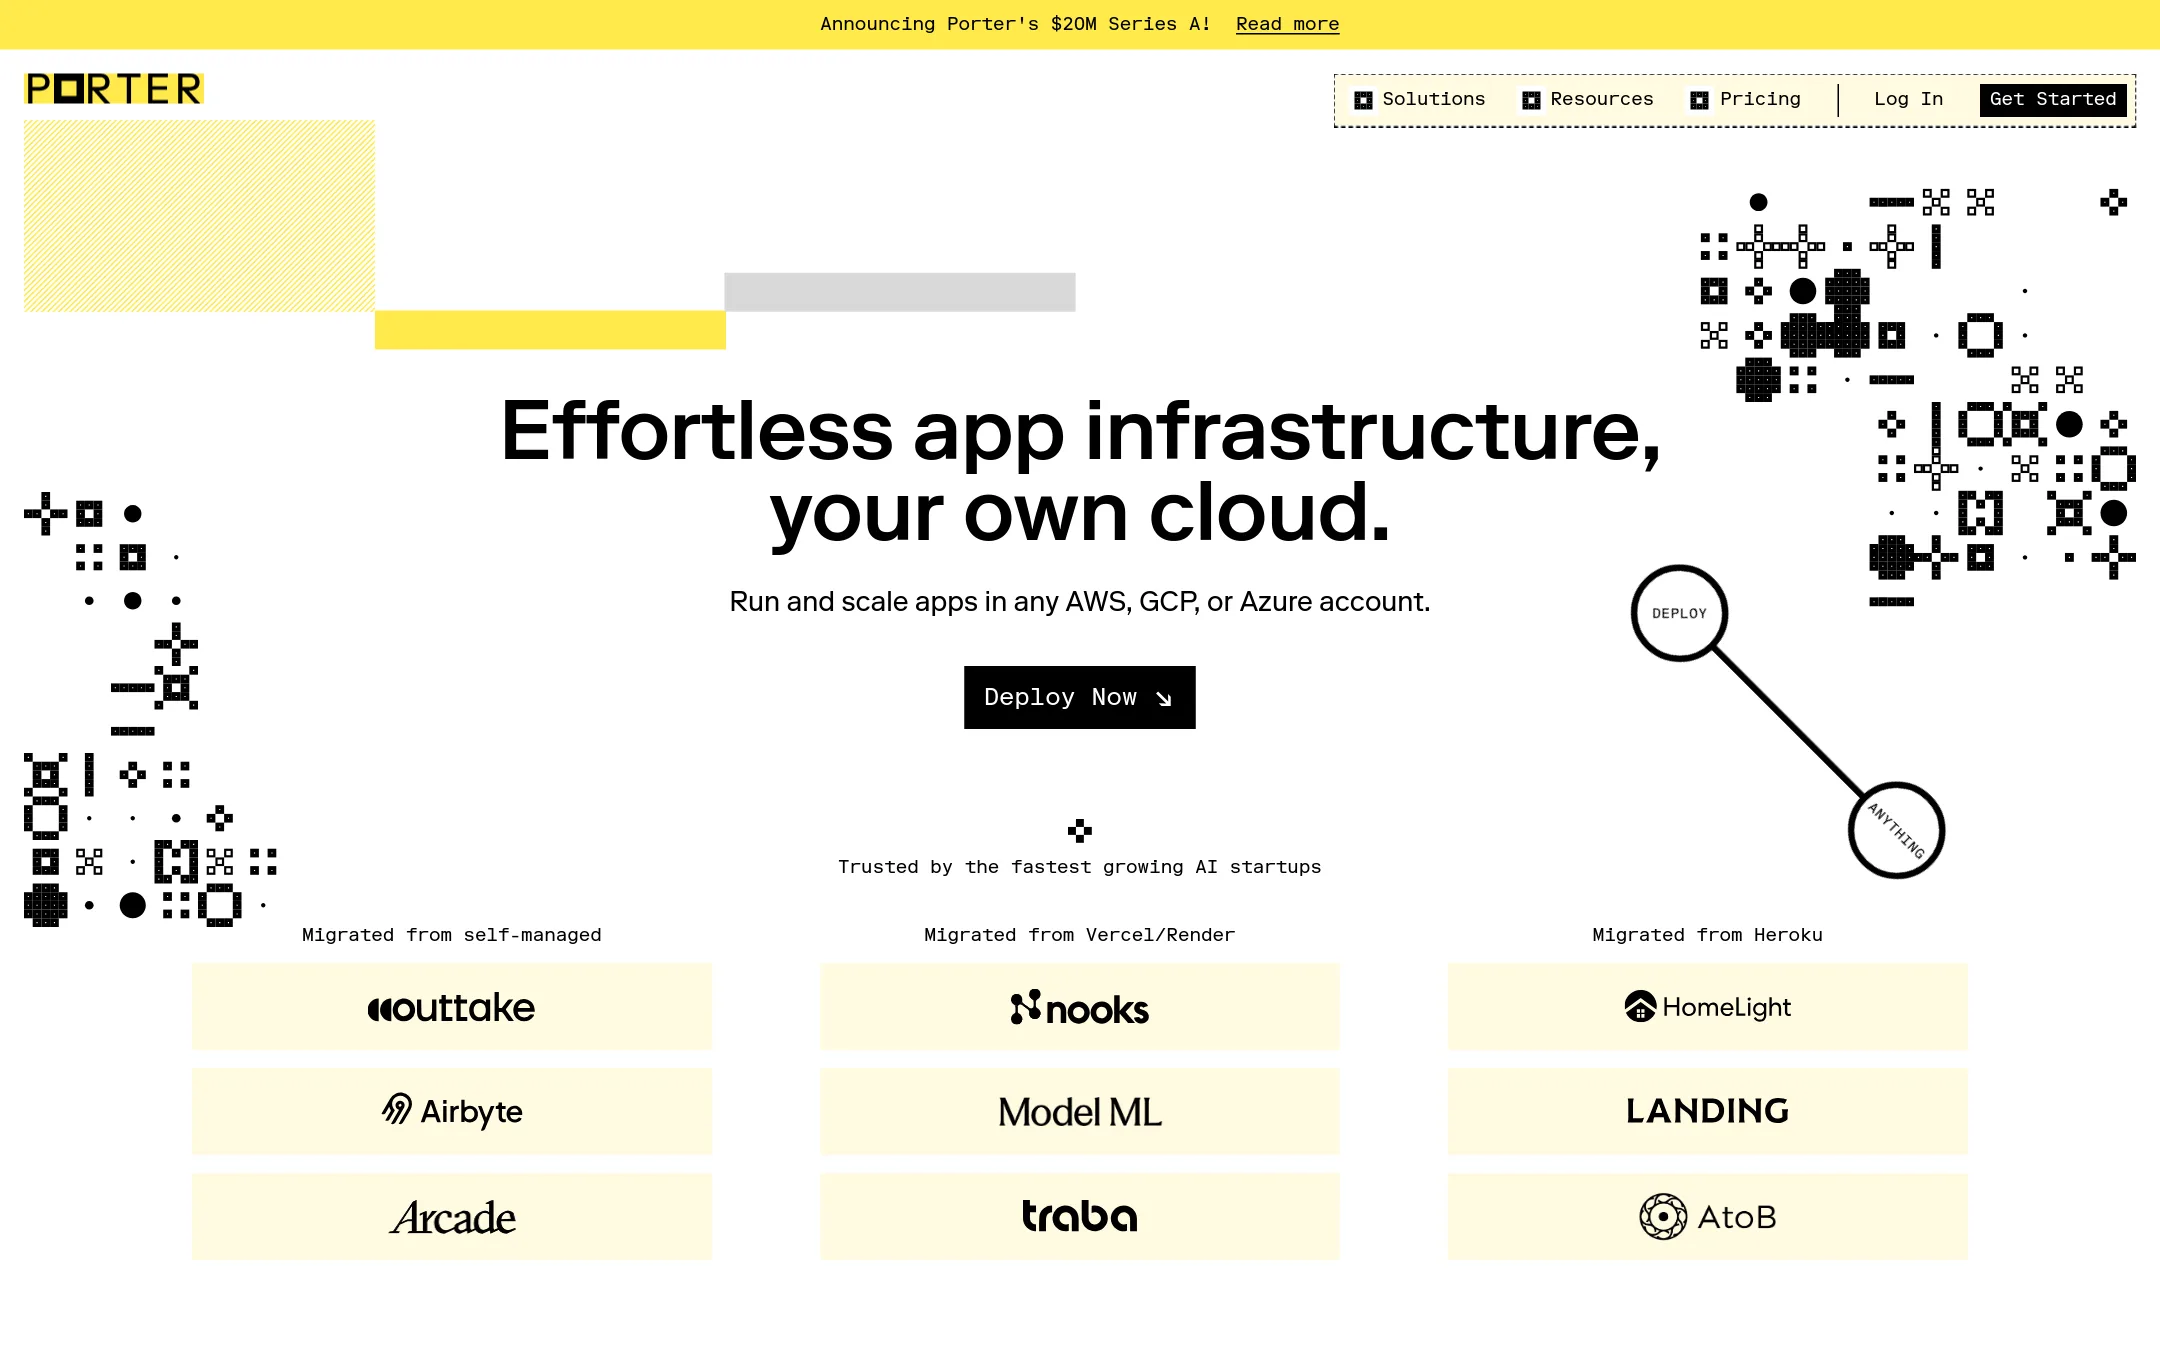
Porter is a platform-as-a-service that deploys your apps into your own AWS, GCP, or Azure account, handling the Kubernetes cluster and DevOps overhead. Choose it over BioRender when you need to ship and scale backend services, databases, or full-stack apps, not scientific figures.
Where it is strong
- Deploys into your own AWS, GCP, or Azure account, so you keep control of your infrastructure.
- Automatic version upgrades, CVE patches, and autoscaling without DevOps overhead.
- Volume discounts make costs scale slower than traditional managed services like ECS Fargate.
Where it falls short
- Pricing does not include the underlying cloud provider cost, so your total bill is higher than the Porter fee alone.
- No scientific figure or illustration capabilities. It's purely for application deployment.
- Pricing:
- Pricing is usage-based: you pay for the resources your applications use, plus the underlying cloud provider cost. For example, every additional 2 vCPU and 4GB RAM is $112/mo on AWS App Runner, but equivalent compute on Porter is $80/mo. Volume discounts apply
See more comparisons in Design & Creative alternatives.
FAQ
Questions about BioRender alternatives
What is the best free alternative to BioRender?
Mind the Graph offers a free plan with no credit card required and 75,000+ editable illustrations. SciDraw provides free CC-BY licensed illustrations you can download and remix. Inkscape is a free, open-source vector editor with no subscription.
Which alternative is best for creating publication-ready scientific figures?
Mind the Graph is designed for scientific figures and graphical abstracts with editable templates. GraphPad Prism is best for publication-quality graphs from data analysis. BioRender itself remains the standard for journal-ready figures.
Are there alternatives that work offline or without cloud dependency?
Inkscape and GraphPad Prism are desktop software that run locally. R with ggplot2 and Python with Matplotlib are code-based and run on your machine. draw.io stores files on your own infrastructure.
Which alternative is best for teams already using a specific cloud provider?
Microsoft Azure CycleCloud is for HPC clusters on Azure. Porter deploys into AWS, GCP, or Azure. For diagramming, draw.io integrates with your own file storage.
Do any alternatives offer AI-assisted figure generation like BioRender?
None of the listed alternatives explicitly offer AI figure generation. BioRender's Leo AI is unique. For code-based automation, R and Python allow programmatic figure creation.
Last updated October 16, 2026.